

Watchlist 06/17 - Before Market Open
5 Stocks, 1 Lens: Which Chart Speaks the Loudest Right Now?

In the sea of tickers that flood your screen each week, how do you decide what deserves your attention? Is it the loud breakout that’s already moved 20%? Or the quiet base forming in the shadows?
Yesterday after market close, I sifted through five different stock charts, from biotech hopefuls to fintech darlings, to separate noise from true technical clarity.
Let’s get right into it.
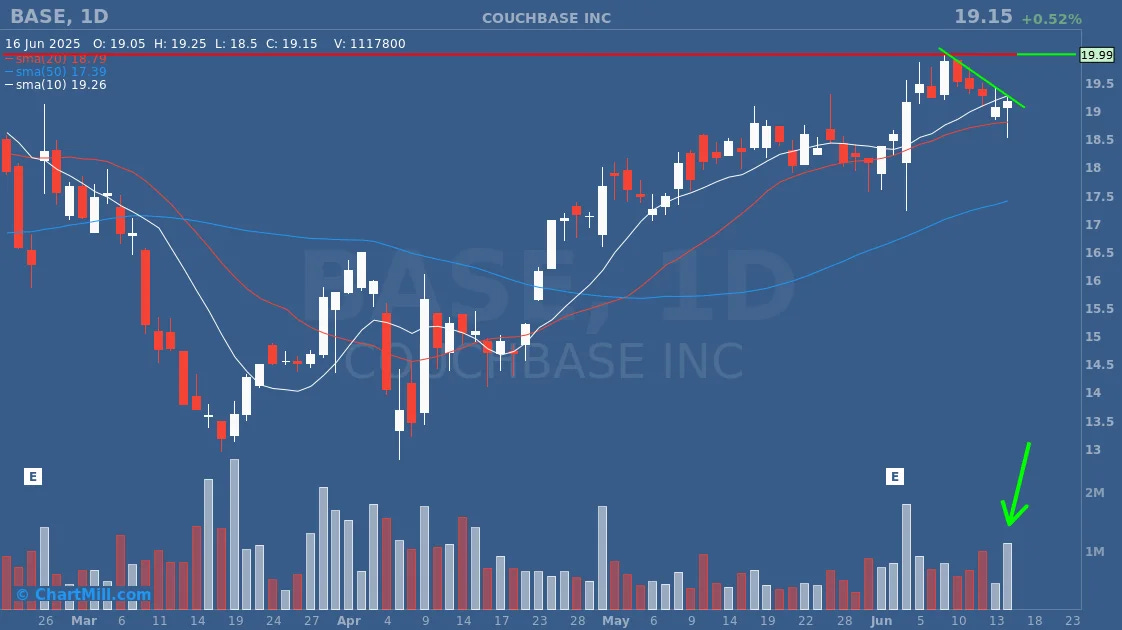
1. BASE (Base Inc.) – Flagging with Intent
BASE has been a relative strength standout, riding a clean uptrend with sharp, upward legs followed by respectful consolidations. The current price action hints at a bullish continuation pattern: a doji candle within a pullback just under the highs, testing the previous resistance level.
Volume tells the truth: Buyers are still showing up on green days, with no signs of distribution.
The play: A breakout above the recent consolidation could trigger a fresh leg higher, especially with volume expanding. It's one of the cleanest setups on the list.
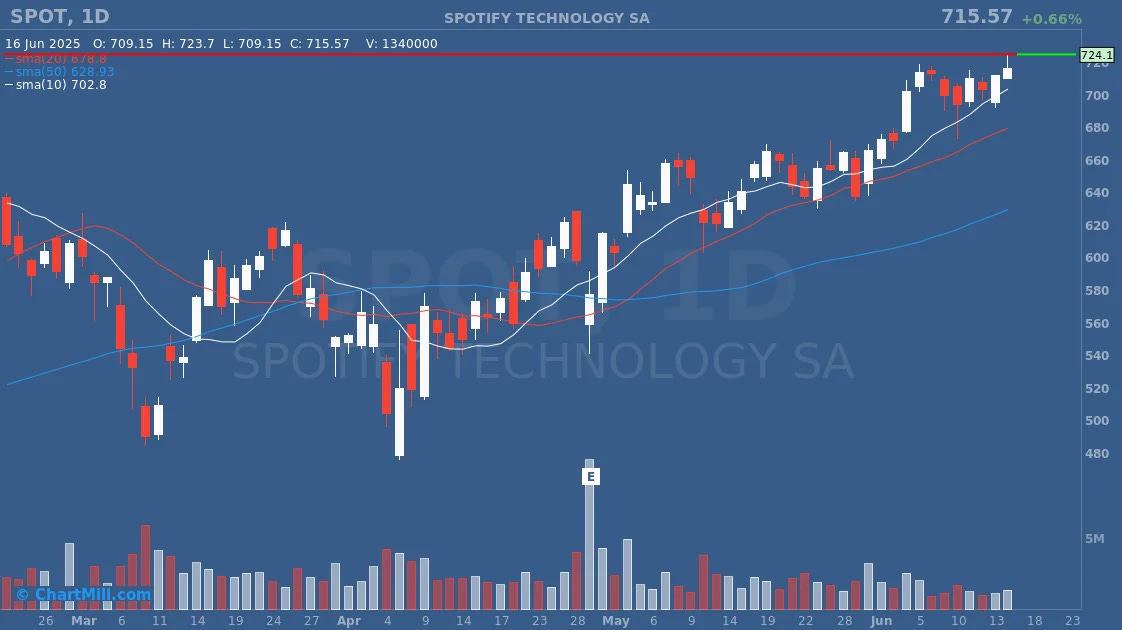
2. SPOT (Spotify) – The Relentless Climber
Spotify doesn’t care about your doubts, it just keeps climbing. This is what strength looks like: higher highs, firm closes, and volume that doesn’t quit.
Despite being extended, it hasn’t shown signs of weakness. Instead, it appears to be forming a sideways trading range, a bullish continuation pattern for aggressive traders.
Key takeaway: Momentum stays with the stock until it doesn’t. But for now, SPOT deserves a top spot on any watchlist, especially if the price can get above that red horizontal line.
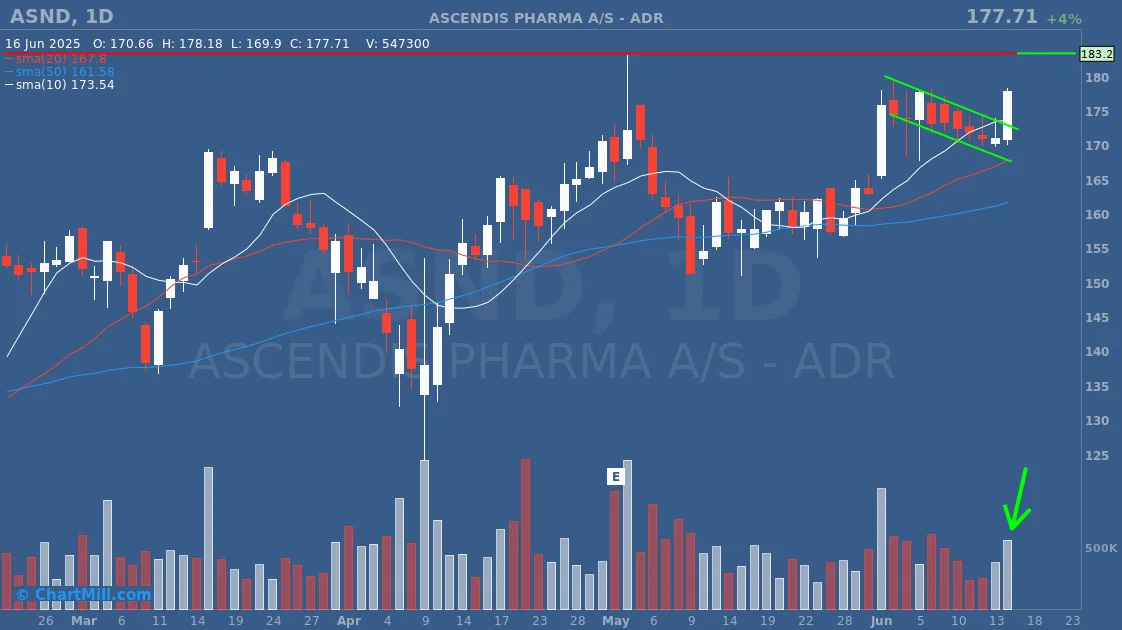
3. ASND (Ascendis Pharma) – A Silent Accumulator
At first glance, ASND might look like dead money but yesterday’s price action changed that. A breakout on higher volume, almost closing at the high of day…
Why it matters: ASND is not quite there yet (current high at ~$183.2), but the way is cleared. An initial small test position if the stock price can continue to rise above yesterday's high definitely doesn't seem like a bad idea.
Patience required. Wait for a volume-backed move out of the base before considering action.
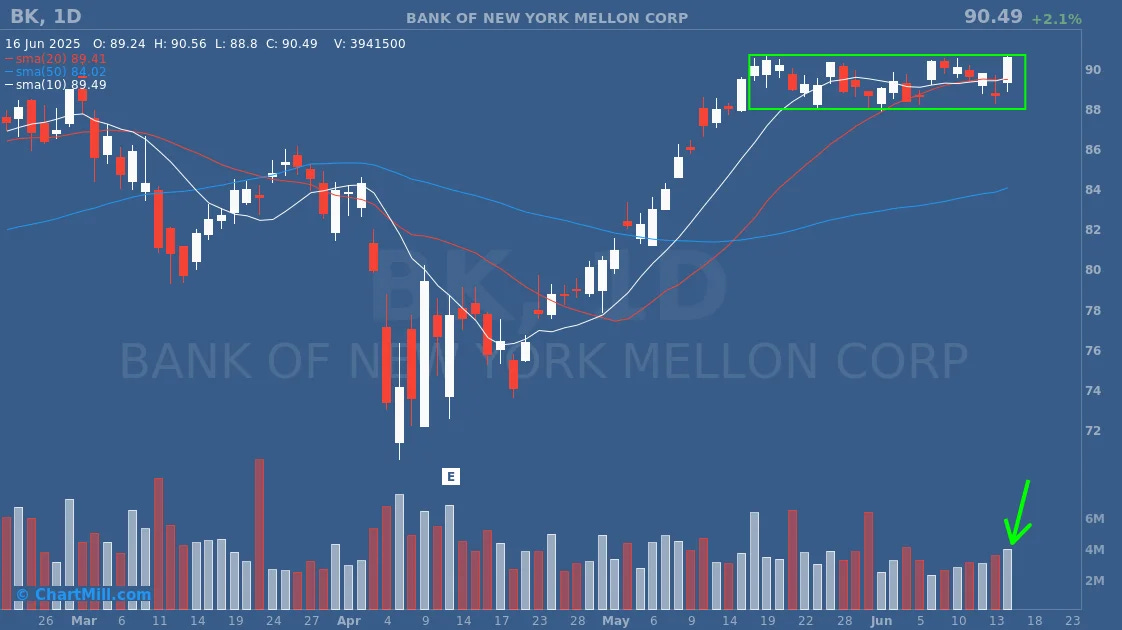
4. BK (Bank of New York Mellon) – Slow and Steady
BK is flashing a clean technical breakout setup. After a period of sideways consolidation, it’s pushing through resistance on increasing volume, confirming institutional interest.
What stands out:
The prior base was tight and well-structured.
It’s moving above previous highs with strong relative strength vs. the financial sector.
Execution edge: Watch for continuation above the breakout level or a retest with support holding. BK is absolutely in play from a pure technical standpoint.
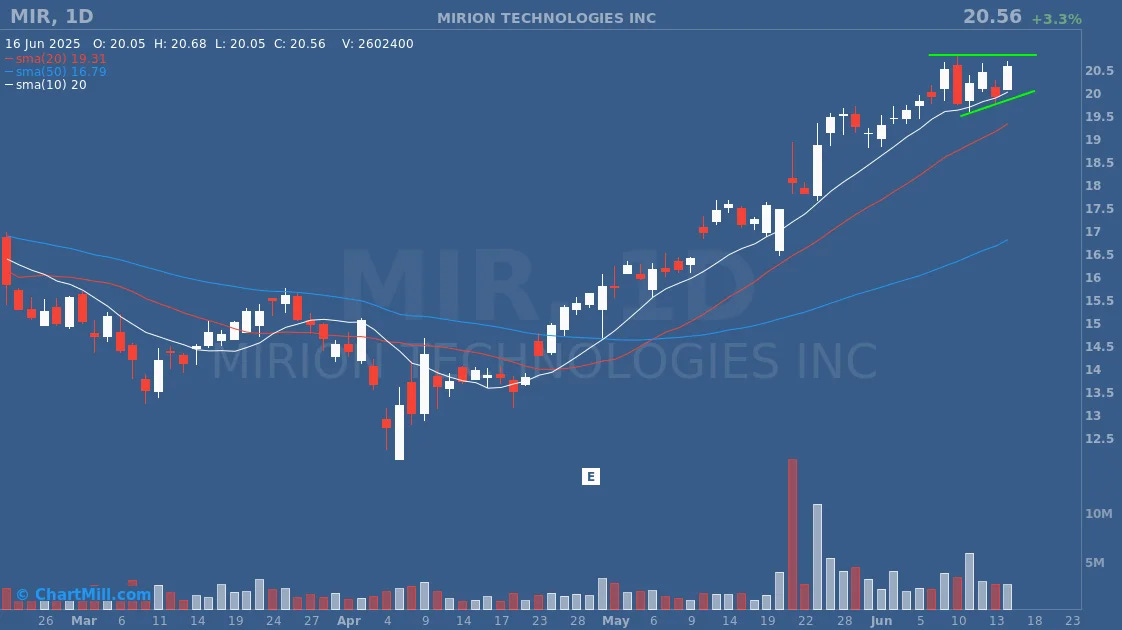
5. MIR (Mirati Therapeutics) – Ascending Triangle, Coiled and Ready
MIR has been marching higher with conviction, and it’s now pressing against the top of a clear ascending triangle, a well known continuation pattern in technical analysis.
Why this matters:
The rising trendline of higher lows shows buyers getting increasingly aggressive.
Flat resistance at the top signals a buildup of energy.
Volume is tightening, a pre-breakout signature.
This isn’t a messy range, it’s a coiled setup with bullish intent. If it breaks above resistance with volume, you’ve got a textbook measured move target in play.
Execution edge: Use the ascending triangle breakout as your trigger. If it clears with momentum, ride the continuation but remember: just stay disciplined on risk, as triangle failures can snap hard.
🧠 Final Thoughts: Trade Ideas Are Cheap, Risk Management Is Gold
Before you chase SPOT into the stratosphere or jump on BASE’s next breakout, ask yourself:
What’s my stop?
Where am I wrong?
How much am I risking relative to my account?
Good risk management doesn’t kill potential. It keeps you in the game long enough to find it.
Charts are maps. Patterns are probabilities. But your edge? That lives in how well you manage your risk when the market proves you wrong, because it will.
⚠️ DISCLAIMER — Important — This Is Not Financial Advice
Everything shared here is for informational and educational purposes only. These setups are meant to inspire your own analysis — not to tell you what to buy or sell.
I hold no positions in any of the mentioned stocks at the time of publishing this article.
Please do your own research, follow your own plan, and manage your risk like a pro. This is your journey, protect your capital and trade with clarity and confidence.