
Mastering Pullback Entries: Two Real-World Swing Trading Setups Explained
Learn how to identify high-quality pullbacks using simple moving averages and the ChartMill screener.

Pullbacks within strong trends offer a great balance between risk and reward, you’re not chasing momentum, but you’re also not fighting the trend.
Today, I want to show you two real pullback setups that perfectly illustrate this approach: NETGEAR Inc. (NTGR) and Cidara Therapeutics (CDTX).
Both examples were found using my ChartMill screeners, which are designed to identify quality setups with strong technical structures.
Let’s break them down.
🟩 Example 1 – NETGEAR Inc. (NTGR)
NTGR recently went through a strong breakout phase, pushing above the 33–34 zone with excellent volume in late September and early October. Since then, price has pulled back toward the rising 20-day SMA, creating a potential entry zone for swing traders.
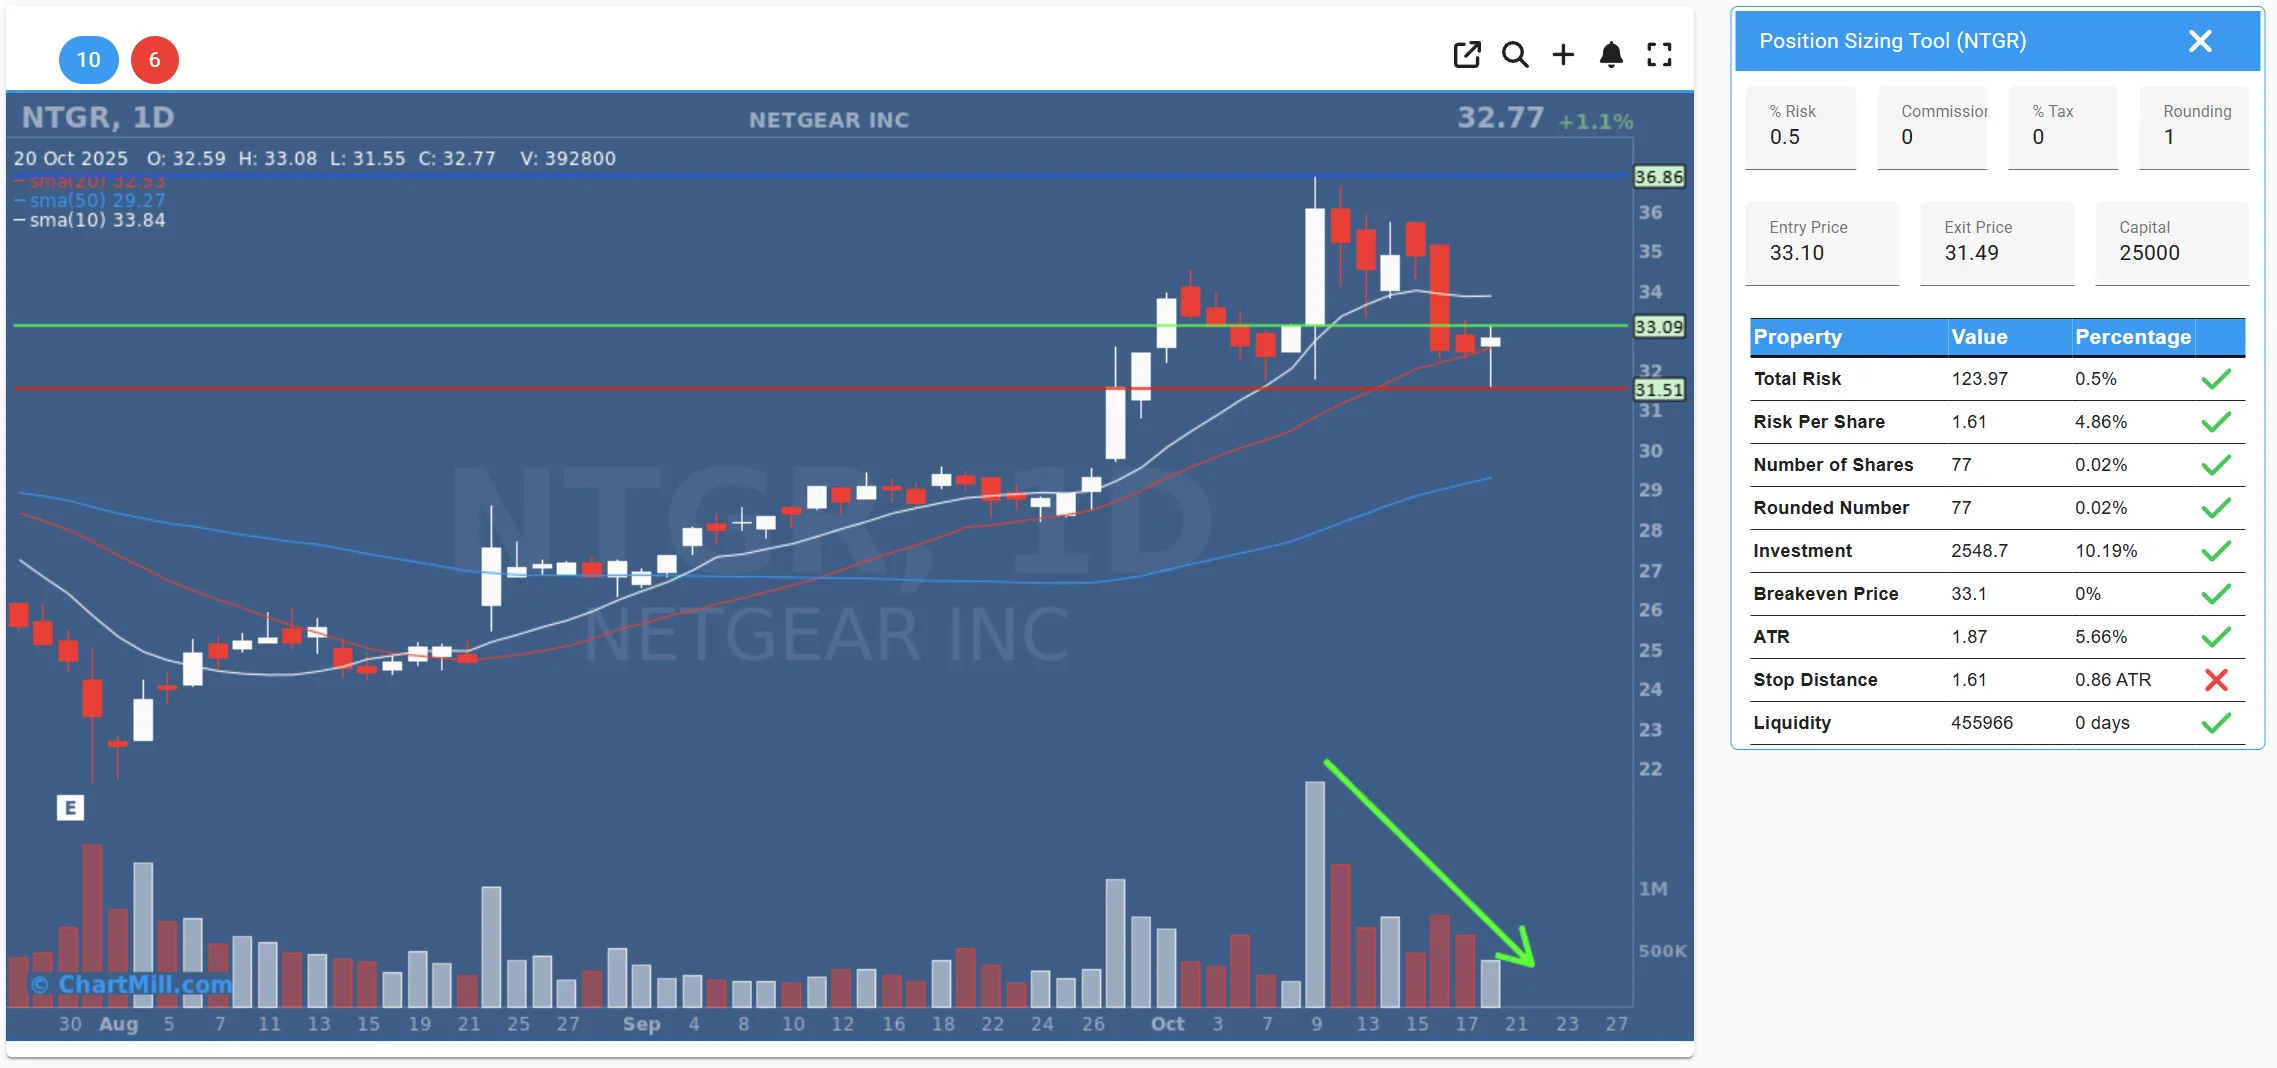
Here’s what stands out:
Trend: Both the 10- and 20-day moving averages are rising, confirming short-term strength.
Pullback quality: The correction has been clean, with consecutive lower highs and lower lows, typical of a textbook retracement.
Volume: Notice the green arrow on the chart, volume has dropped during the pullback. That’s exactly what you want to see. It signals that selling pressure is drying up.
Support zone: Around $31.50, where the SMA(20) comes in, buyers have already stepped up once.
In this setup, I’d be looking for an entry near $33.10, with a stop loss at $31.49. The first target could be a retest of the previous high around $36.80.
That gives a solid reward-to-risk ratio, provided the trend resumes.
🟩 Example 2 – Cidara Therapeutics (CDTX)
CDTX shows a very similar structure but with even stronger prior momentum. After a steep rally that peaked near $121, the stock pulled back neatly to the rising SMA(20) and SMA(50).
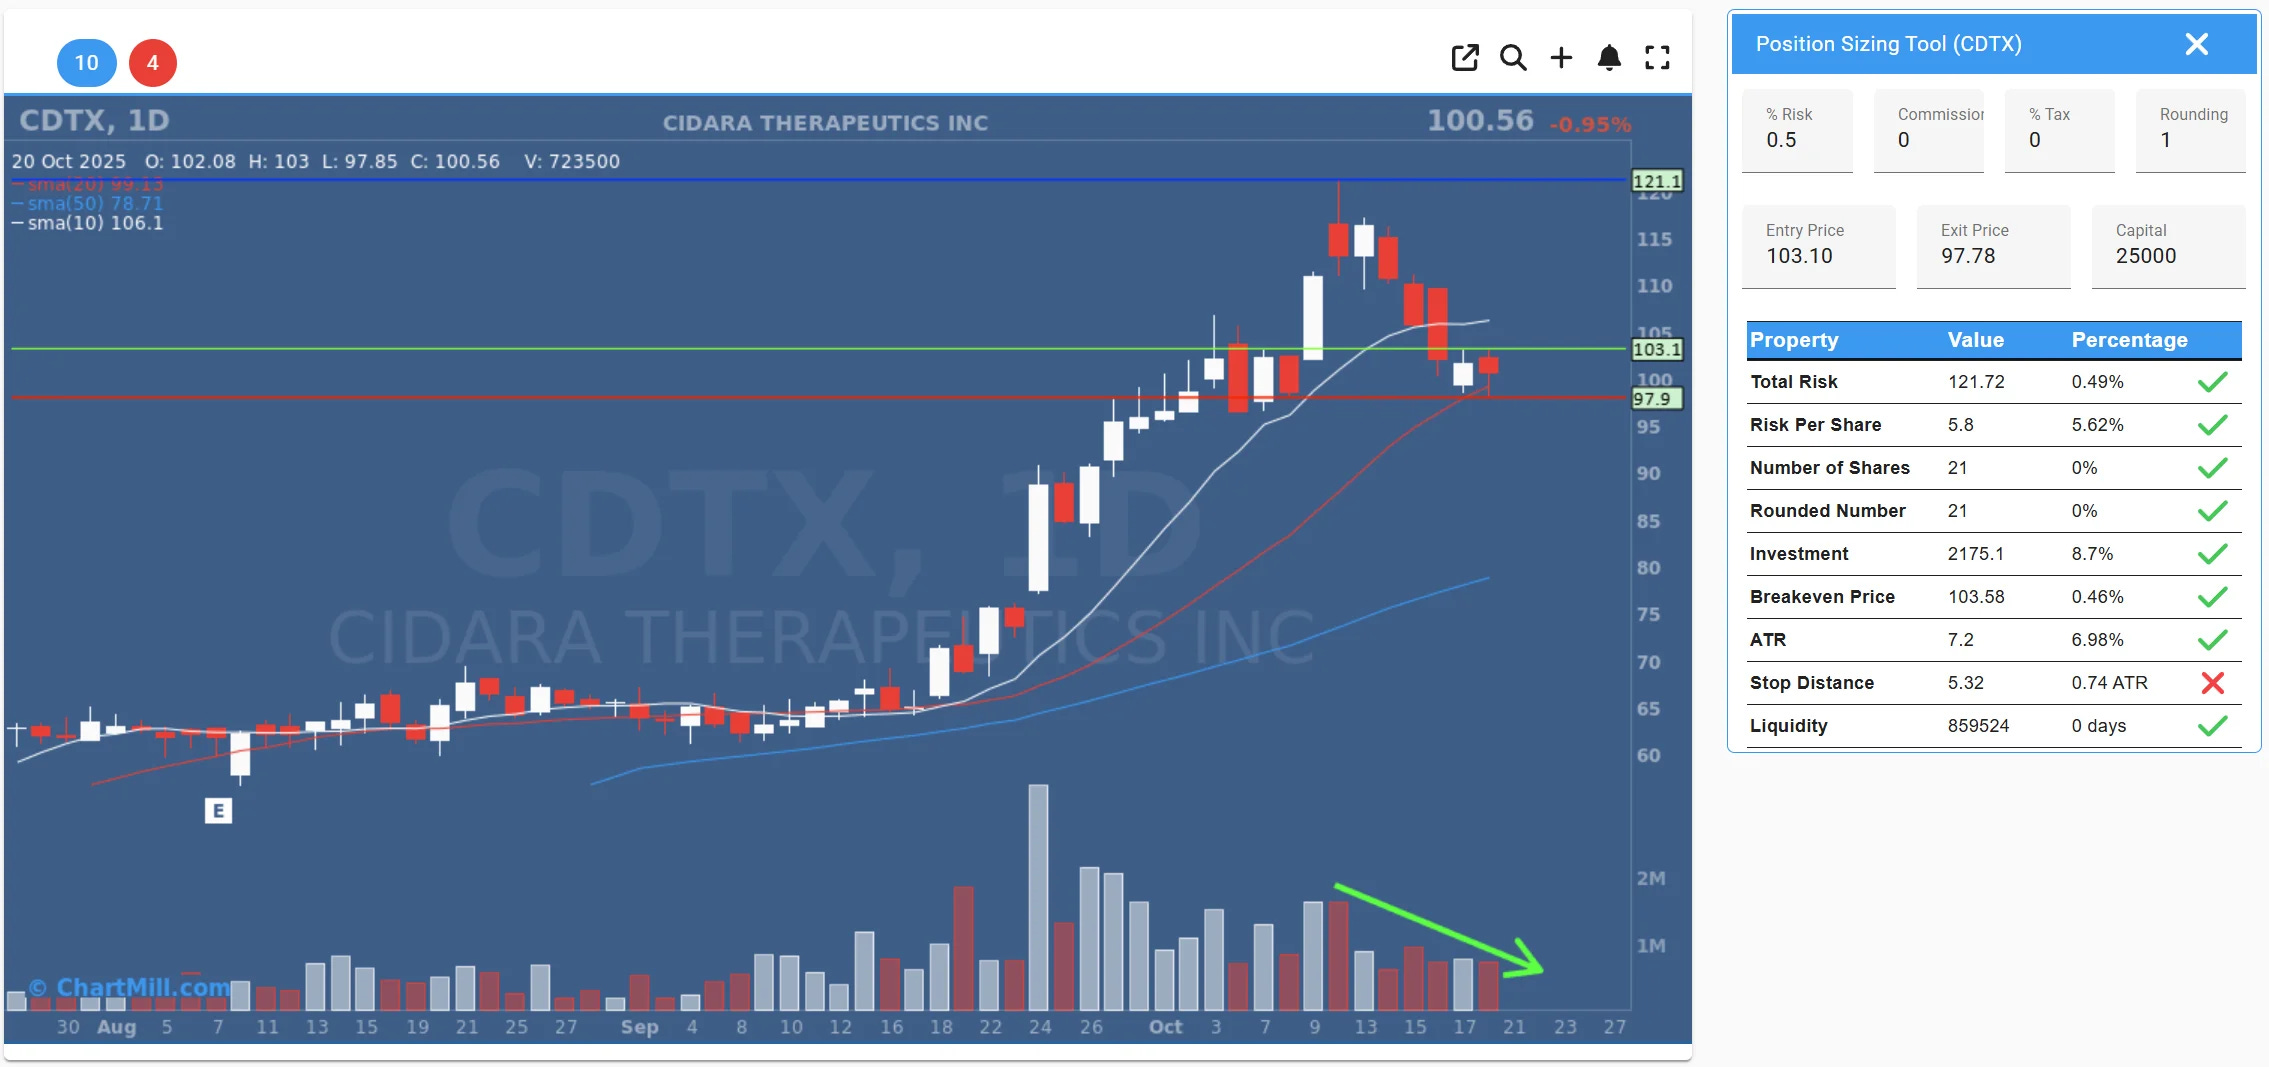
Here’s why I like it:
Uptrend intact: The price remains above the SMA(20), with the 10-, 20-, and 50-day SMAs all sloping upward.
Healthy correction: The pullback reached the 20-day average, but not much deeper, typical of a strong name where buyers step in early.
Volume confirmation: Again, we see declining volume during the retracement, highlighted by the green arrow, a great sign that the move down is corrective, not distributive.
Support area: Around $98–$100, aligned with prior breakout levels.
The planned trade setup here is an entry near $103.10, with a stop at $97.78.
That’s a manageable risk considering the ATR and structure of the pullback.
A rebound from this area could easily retest the prior high near $121, giving plenty of upside potential.
📈 Key Takeaways
Both NTGR and CDTX are textbook pullback candidates, they share these critical elements:
✅ Strong prior uptrend
✅ Clean correction with lower lows and lower highs
✅ Declining volume during the pullback
✅ Support confluence near rising moving averages (SMA10/SMA20)
When these factors line up, the probability of a trend continuation increases significantly.
🎥 Coming Soon: Video Breakdown
If you’d like to see exactly how I find these kinds of setups using ChartMill, stay tuned, a brand-new video tutorial will be released shortly on our YouTube channel.
In it, I’ll walk you through the full process step-by-step, from building the screener filters to analyzing potential entries and exits.
Make sure you’re subscribed so you don’t miss it!
💬 Final Thoughts
Pullback setups like these are my bread and butter. They allow me to trade with the trend, but with defined risk and better entry prices.
Do you prefer pullbacks or breakouts in your own swing trading?
Let me know in the comments below, I’m always curious how others approach these setups.
Trade Safe!
Kristoff
NTGR > Setup cancelled after yesterday's 22 close
CDTX > Setup triggered (october 21) and stopped out next trading day (-0.5% on equity)
Hey Kristoff, I'd love to know how you identify these setups. What screener or tools do you use to find them?