
3 Swing Setups Under the Microscope
Rational Trading Decisions Backed by Price Action and Momentum

As a swing trader with a strong focus on price action, momentum, and risk management, today I’m looking at three interesting charts presenting themselves as potential swing setups.
All three were found using the Minervini Trend Template Trading Idea in ChartMill.
Fundamentals aren’t my primary concern, though I do keep a half-eye on revenue and earnings trends to get a sense of acceleration. My process is simple: identify powerful patterns, determine support and resistance, trade the plan, and cut losing positions quickly.
Janus International Group (JBI)
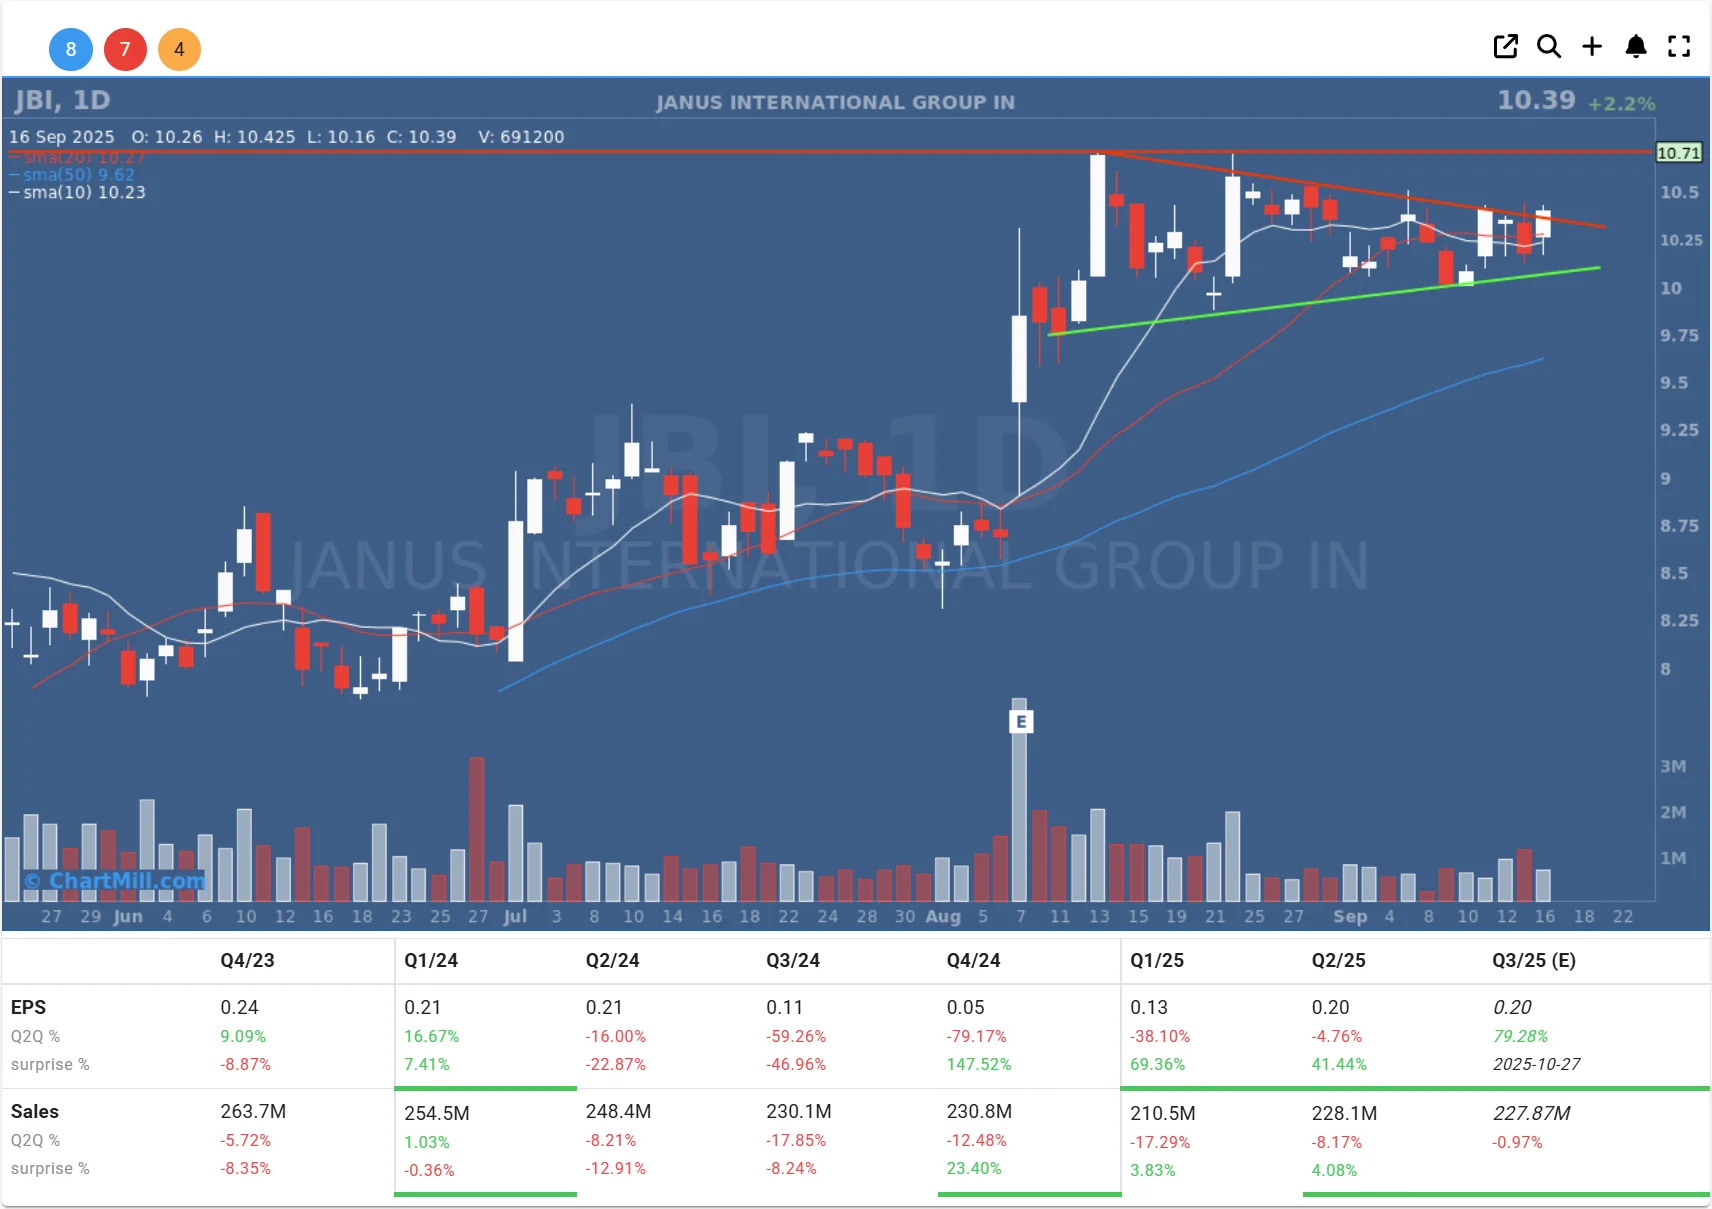
Technical picture: The stock has seen a solid rise over the past few months and is now consolidating in a symmetrical triangle. Higher lows (green line) indicate underlying buying pressure, while lower highs (red line) form resistance.
Key levels: Support around $10, resistance around $10.70.
Plan: I see a classic volatility contraction pattern (à la Minervini). A breakout above $10.70 on volume is the signal to enter. Stop just below the last higher low (around $10) for a tight risk/reward.
Momentum check: The 10-day SMA is above the 50-day, positive, but I want to see volume pick up on a breakout.
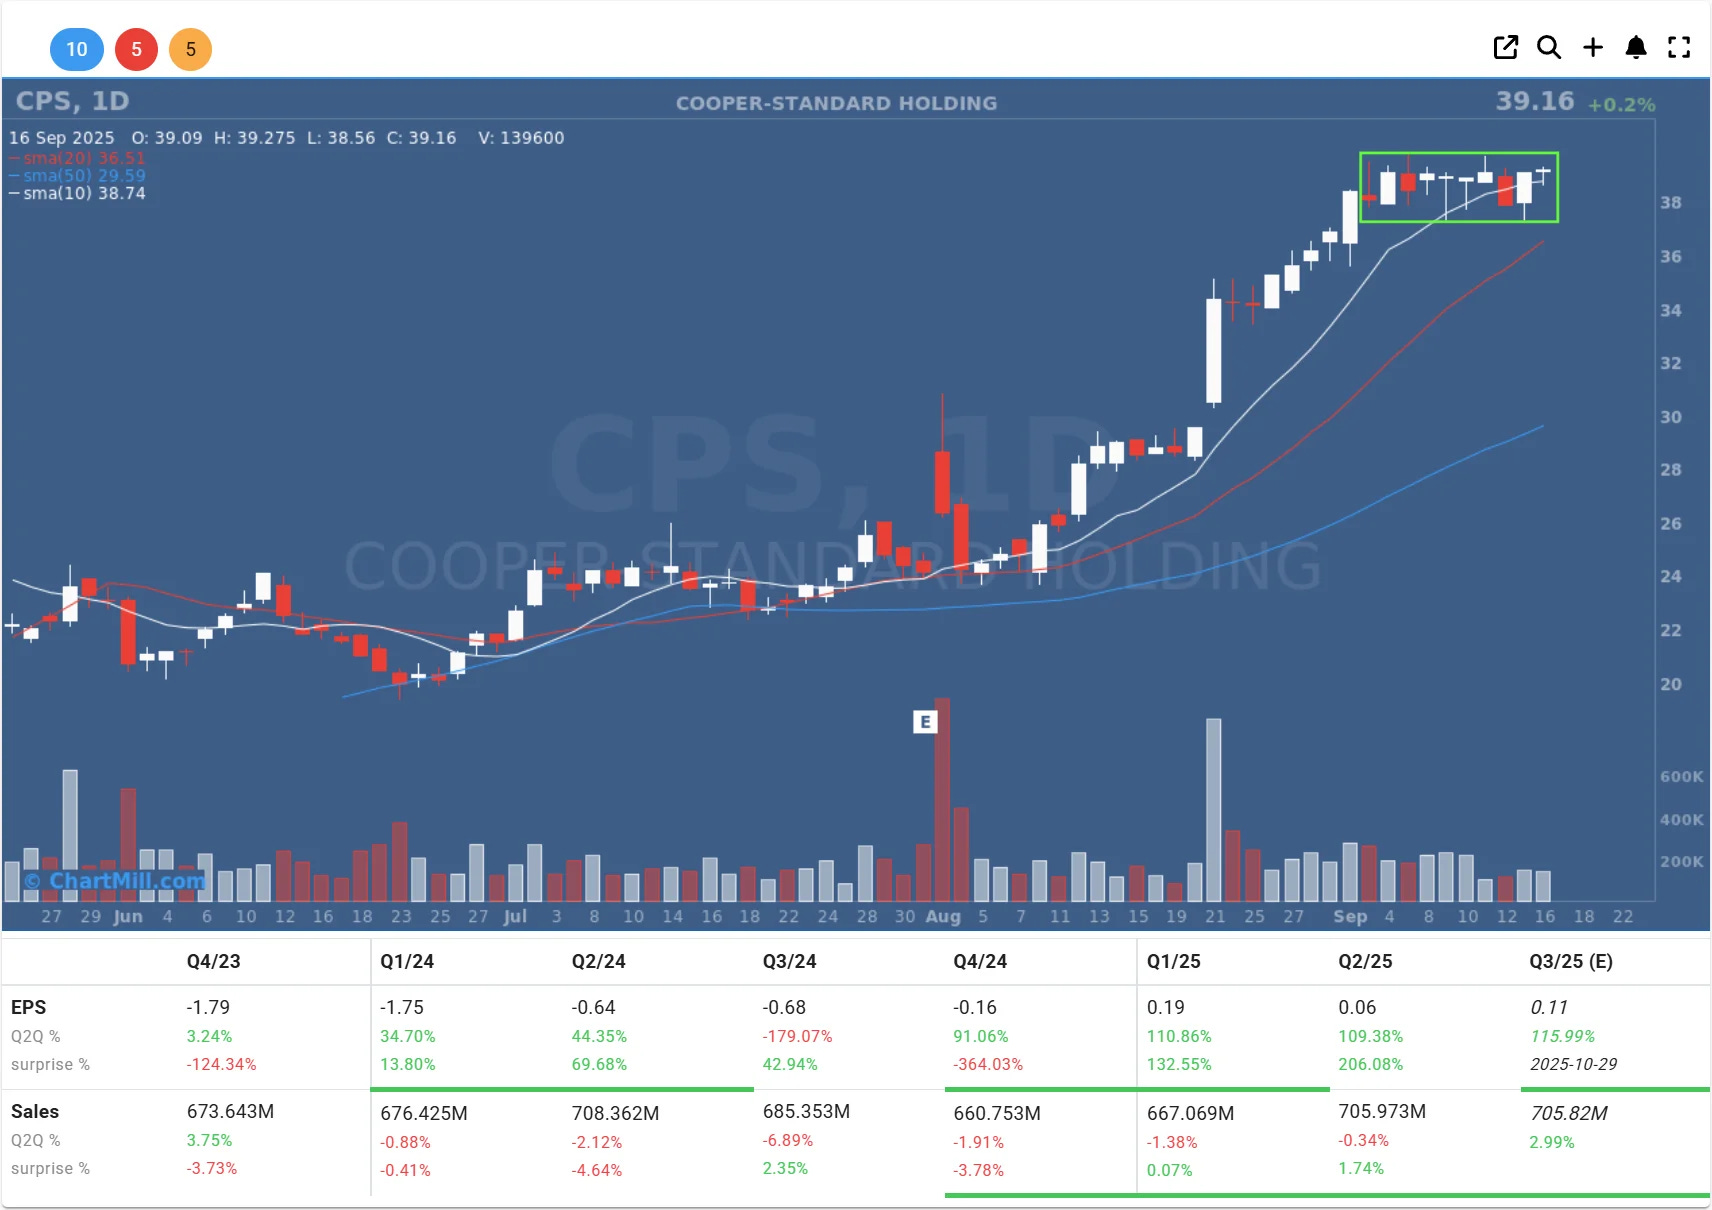
Technical picture: This chart shows pure relative strength. After a strong run in late July, it is now in a tight sideways consolidation (rectangle). This is exactly the kind of tight base I look for after a powerful run.
Key levels: Support just below $37, resistance around $40.
Plan: A strong close above $40 with increased volume could signal a new leg higher. Stop under $38.00 or under the 10-day SMA, depending on personal risk tolerance.
Momentum check: Both the 10- and 20-day SMAs are well above the 50-day. This is a leader, not a laggard.
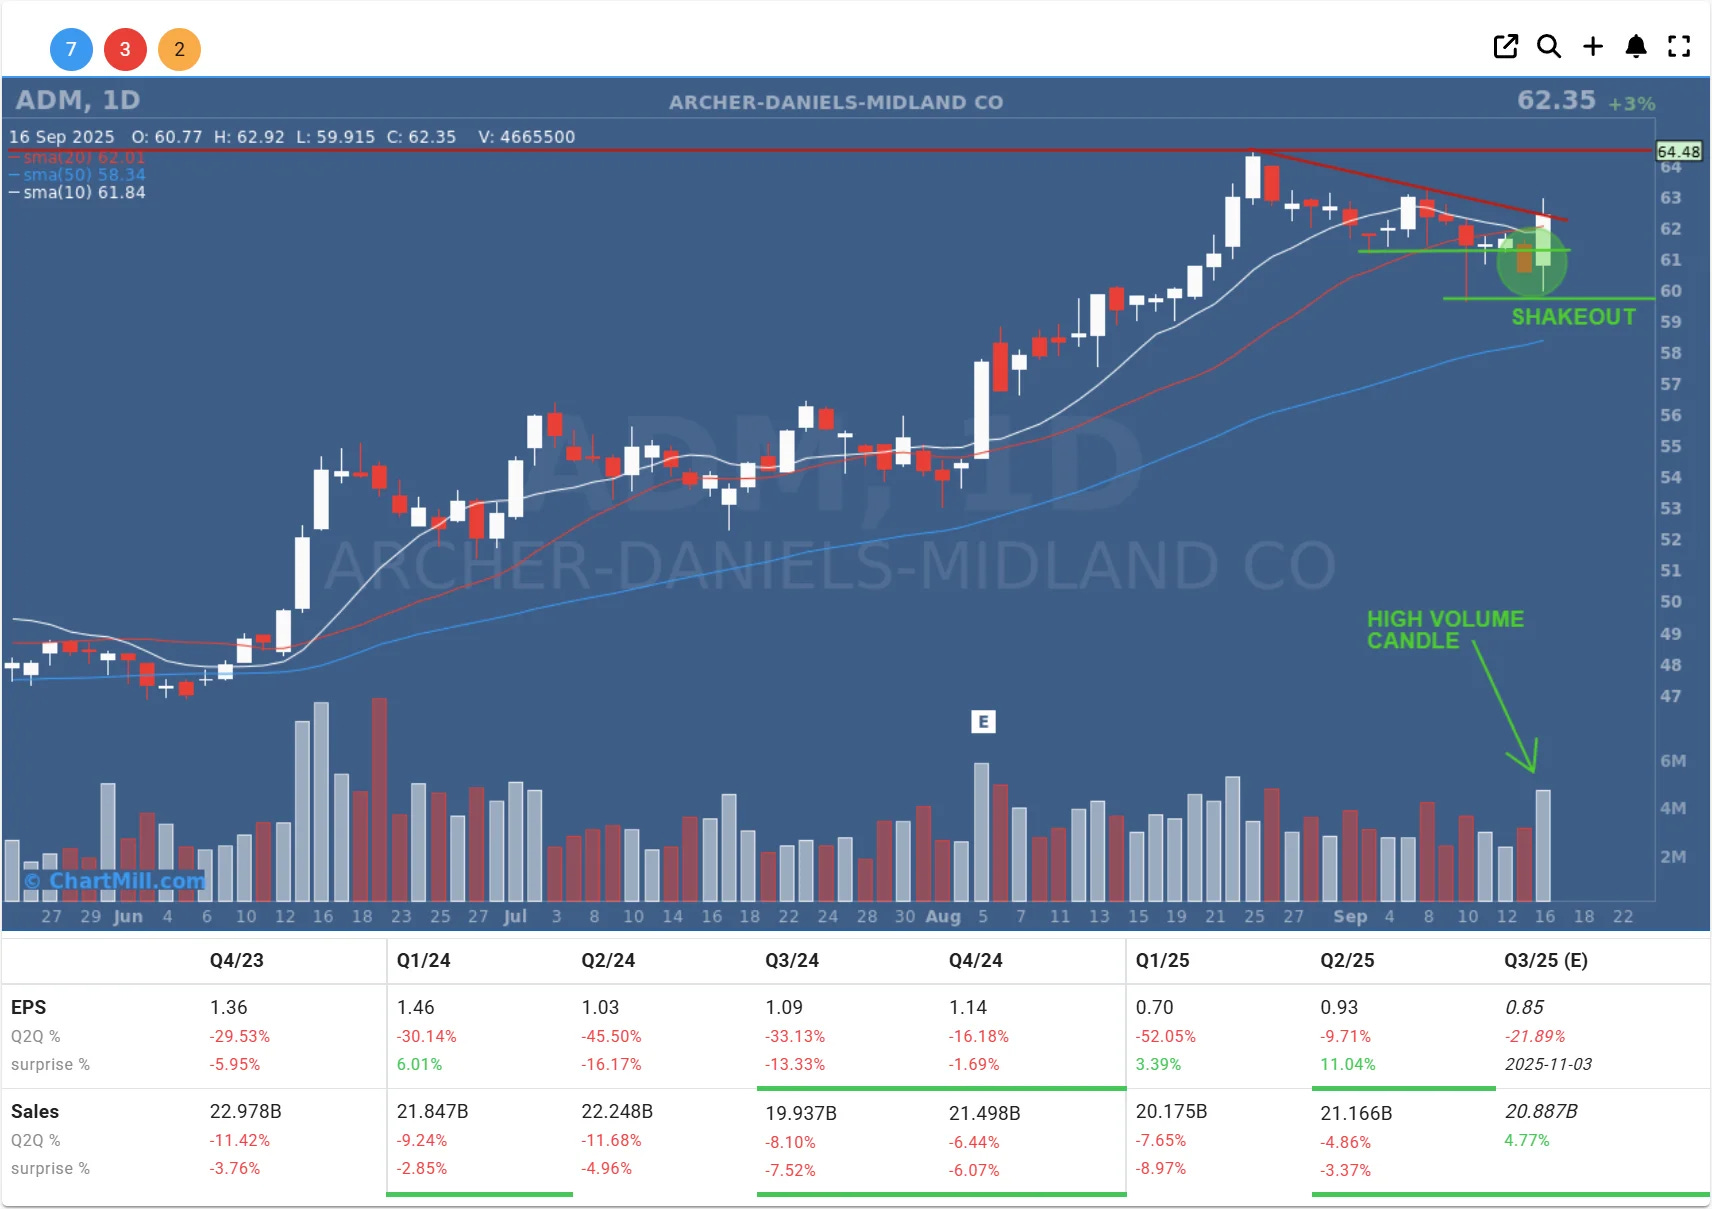
Technical picture: ADM has corrected and appears to have completed a shakeout. The high-volume candle that pushed the price back above the falling trendline is a positive signal.
Key levels: Support around $60, resistance near $64.50.
Plan: An aggressive trader might take an initial position with a stop just below $60. More conservative traders wait for a clear close above $64.50 to confirm a new trend.
Momentum check: The 10-day SMA is turning up again and heading toward the 20-day. Volume is key—I want confirmation of institutional buying power.
Conclusion
Each of these setups has its own character:
JBI: Tight triangle, waiting for a breakout.
CPS: Relative strength and tight consolidation, a potential leader.
ADM: Shakeout followed by renewed strength, a chance for a trend reversal.
In every case, risk management remains primary. I consistently use stops just below critical support and cut losing positions without hesitation. The goal isn’t to win every trade but to keep losers small and let winners run.
As O’Neil would say: “All stocks are bad unless they go up.” The chart tells the story; my job is to listen and act, without emotion, only with a disciplined plan.
Kristoff - ChartMill
This analysis is for educational purposes only and is not investment advice. Always trade according to your own risk profile.
I currently hold no position in any of the stocks mentioned above.